Have you ever found yourself making assumptions about how your product is used and what users think of it?
They don’t follow the entire onboarding process.
They don’t want to see our new feature.
This part of the application is too heavy for our users.
Our customers prefer red flowers instead of blue ones.
Data analysis has always played an important role in the development of a company. A healthy decision about a product or brand should be made involving an analysis of user feedback. The type of information that helps you better understand how customers think and use your product.
All of these are insights gained through the use of statistics and data analysis. The true strength of analytics is that it allows you to better understand your audience and stay relevant to your customers.
What is the customer onboarding process?
When we talk about customer onboarding we refer to the process of introducing new customers and users to your product and help them engage effectively with it.
The way you onboard your new clients sets the tone for your long-term connection. Customers’ lifetime value, churn reduction, and popularity growth are all increased by customer-centric strategy.
Bytes Route, as a complete digital adoption tool, has created and implemented a series of analytics and reporting to help you gain and use information about your users to improve your onboarding process.
Web tours help you eliminate some of the difficulties that customers have while using your product. Among other things a properly created onboarding tour can significantly reduce the flow of emails that the support team normally receives.
How to optimize your customer onboarding tours?
If you want to understand your consumers’ actions and behavior, you should constantly check your tours’ statistics.
One of the most important parts of the whole process of evaluating the value of a product tour is analyzing how it is currently performing. It will give you an idea of what to change and how to improve it.
If your users often:
- Abandon the product tour right after starting it
- Don’t finish a tour they started
- Finish a tour, but ask for support
then it means that you should make some changes to make the tours more efficient.
Here are some tips on what you can do to improve your customer onboarding process:
1. Reduce the number of steps
If you observe that some users started your tour, but dropped off at some point, it could mean that you didn’t succeed in holding their attention. You should try different product walkthroughs lengths. Other recommendations would be to eliminate some steps that may be included in other tours or that are not essential.
2. Make sure your steps’ descriptions are clear
Users should understand exactly what they have to do. Try to use easy to understand words and avoid squeezing too much information in one step. Keep in mind that most of the time you deal with non-technical people.
3. Provide clear next steps
An efficient tour should explain exactly the next step the user is supposed to take. Don’t leave consumers asking themselves where they should begin or where they should click next. This will increase the completion rate.
4. Improve your copy and design
Consumers are more likely to engage with your guided product tour if it fits in the context and is well-designed. Match your brand colors to create a native look.
The power of good copywriting cannot be overstated. When building the tours, think about how you are communicating with your customers. Use clear and concise words and try to pay attention to what words users use when they ask questions and include them.
Customer Onboarding Tours Analytics
Depending on your plan, Bytes Route will provide a unique set of analytics for each onboarding tour. Let’s dive into Bytes Route’s analytics and reporting:

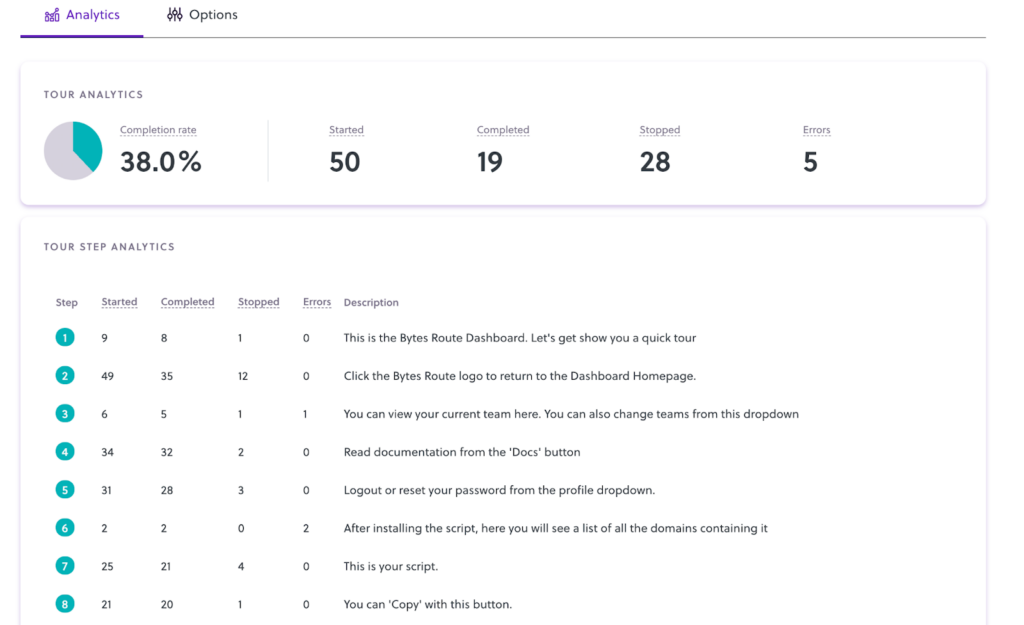
This is how Bytes Route statistics look like. We have tried to offer you as much value as possible and not let outside any of the data that might be relevant to your onboarding optimization process – so, if it seem a little complex it’s because of that.
Tour Analytics
In the first container, the Tour Analytics shows an overview of the entire tour. Essential data such as the time started and completion information is there, here’s more information about them:
- Started – The value that indicates how many times a tour was started. There are two different ways to start a tour, check our docs for more details.
- Completed – This tells you how many times the tour was completed by a customer, the tour is marked as completed when the customer goes through all the tour steps and completes the last step.
- Stopped – This value shows how many times users stopped the tour before the end. They can stop the tour for several reasons. For example, a tour may not come to an end due to the lack of relevance to the consumer.
- Errors – This is the value that you should keep at 0, because it indicates that a tour is not working properly at certain steps. This can also be a reason why consumer doesn’t complete the tour. The value represents the accumulation of data extracted from each step.

The Tour Analytics section is a key part of a tour and you should check it constantly if you want to understand a user’s behavior. For a better understanding of the product tour, we also offer an individual statistic on each step.
Tour step analytics
From the Tour Step Analytics, we can extract information about each step, like: the created tour is too complicated or too long, a step is outdated and generates errors, or the description of the step is too ambiguous.
On the table, you can see that each step was assigned one of these values: Started, Completed, Stopped and Errors. We can interpret these values to understand the importance of each step of the tour.
- Started – This is the value that indicates how many times the tour has reached that step.
- Completed – It tells us how many times you have successfully passed that step.
- Stopped – This is the value of each step that indicates that the tour was stopped at that step. It should be treated more carefully because it is the main value from which we could conclude that the tour is not working: it may be irrelevant, tiring or simply too long.
- Errors – It counts how many times a user has experienced a problem at a step. If the step does not have a value of 0 next to the errors, it is advisable to edit the step because it can ruin the whole experience of running the tour. Various errors can occur, most of which are due to the fact that the tour is outdated and some steps can no longer be found. We are constantly improving the application core to create a smoother user experience. Here are some of the issues we’ve faced in the past.

Note: Tour analytics are incremented only when you launch the tour from the tour launcher or programmatically using the custom triggering method. For testing purposes, there are two more ways to launch a tour: from the web application dashboard or from the extension. You can learn more about tour consumption in our Docs.
After editing some tour steps, some statistics may no longer be relevant. That is why we recommend you to reset the statistics or delete the step errors in the Analytics reset actions section, located immediately after Tour Step Analytics, at the bottom of the page.

Walkthrough onboarding tours are a big plus through the customer onboarding process. But is it enough? How can you figure out if a tour really matters to your users? I think you already know the answer to this question, and that is: by evaluating the numbers.
Creating a tour is just a small part of the entire process, the tricky part is when you start improving the tour using its statistics. Tour statistics are the most powerful and accurate resource you can use when making improvements.
Analyzing the statistics of a tour is probably the most important part of the whole process. They help you understand what is relevant to your client and predict trends and behavior.
For additional information, you can also check the Analytics documentation.
We hope you found this article useful. Are you ready to dive into tour analytics and have an efficient onboarding process?


